veditor.utils.image_utils module
- veditor.utils.image_utils.arr2pil(frame: numpy.ndarray[Any, numpy.dtype[numpy.uint8]]) → PIL.Image.Image[source]
Convert from
frame(BGRnpt.NDArray) toimage(RGBImage.Image)- Parameters
frame (npt.NDArray[np.uint8]) – A BGR
npt.NDArray.- Returns
A RGB
Image.Image- Return type
Image.Image
- veditor.utils.image_utils.pil2arr(image: PIL.Image.Image) → numpy.ndarray[Any, numpy.dtype[numpy.uint8]][source]
Convert from
image(RGBImage.Image) toframe(BGRnpt.NDArray).- Parameters
image (Image.Image) – A RGB
Image.Image- Returns
A BGR
npt.NDArray.- Return type
npt.NDArray[np.uint8]
- veditor.utils.image_utils.cv2plot(frame: numpy.ndarray[Any, numpy.dtype[numpy.uint8]], ax: Optional[matplotlib.axes._axes.Axes] = None, isBGR: bool = True) → matplotlib.axes._axes.Axes[source]
Plot a
frame.- Parameters
frame (npt.NDArray[np.uint8]) – Input image.
ax (Optional[Axes], optional) – An
Axesinstance. Defaults toNone.isBGR (bool, optional) – Whether
frameis BGR (OpenCV format) or not. Defaults toTrue.
- Returns
An
Axesinstance withframedrawn.- Return type
Axes
- veditor.utils.image_utils.draw_text_in_pil(text: str, ttfontname: str, img: Optional[PIL.Image.Image] = None, xy: Tuple = (0, 0), img_size: Tuple = (640, 360), img_mode: str = 'RGB', bgRGB: Union[str, Tuple] = 'white', textRGB: Union[str, Tuple] = 'black', fontsize: int = 16, fontheight: Optional[int] = None, line_height: Optional[int] = None, anchor: Optional[str] = None, spacing: int = 4, align: str = 'left', direction: str = 'ltr', features: Optional[str] = None, language: Optional[str] = None, stroke_width: int = 0, stroke_fill: Optional[Union[str, Tuple]] = None, embedded_color: bool = False, wrap_text: bool = False, text_width: Optional[int] = None, margin_right: int = 0, drop_whitespace: bool = False, ret_position: str = 'word') → PIL.Image.Image[source]
Draw text in pillow image (
Image.Image).- Parameters
text (str) – Text to be drawn to
img.ttfontname (str) – A filename or file-like object containing a TrueType font.
img (Optional[Image.Image], optional) – The image to draw in. If this argment is
None, img will be created usingimg_sizeandbgRGBarguments. Defaults toNone.xy (Tuple, optional) – Where to write the
text. This value means the coordinates of (x,y). Defaults to(0, 0).img_size (Tuple, optional) – The image size. Defaults to
(640, 360).img_mode (str, optional) – Optional mode to use for color values. Defaults to
"RGB".bgRGB (Union[str, Tuple], optional) – The color of background image. Defaults to
"white".textRGB (Union[str, Tuple], optional) – The color of text. Defaults to
"black".fontsize (int, optional) – The font size. Defaults to
16.fontheight (Optional[int], optional) – The font height. (If not given, automatically calculated.) Defaults to
None.line_height (Optional[int], optional) – The line height. (If not given, automatically calculated.) Defaults to
None.anchor (Optional[str], optional) – The text anchor alignment. Defaults to
None.spacing (int, optional) – The number of pixels between lines. Defaults to
4.align (str, optional) – Determines the relative alignment of lines. Defaults to
"left".direction (str, optional) – Direction of the text. Defaults to
"ltr".features (Optional[str], optional) – A list of OpenType font features to be used during text layout. Defaults to
None.language (Optional[str], optional) – Language of the text. Defaults to
None.stroke_width (int, optional) – The width of the text stroke. Defaults to
0.stroke_fill (Optional[Union[str, Tuple]], optional) – Color to use for the text stroke. If not given, will default to the
textRGBparameter. Defaults toNone.embedded_color (bool, optional) – Whether to use font embedded color glyphs (COLR, CBDT, SBIX). Defaults to
False.wrap_text (bool, optional) – Whether to wrap
textfor multilines or not. Defaults toFalse.text_width (Optional[int], optional) – The length of characters in one line. Use it if you specify
wrap_text==True. Defaults toNone.margin_right (int, optional) – Right margin of text in image. Use it if you specify
wrap_text==True. Defaults to0.drop_whitespace (bool, optional) – If
True, whitespace at the beginning and ending of every line. Defaults toFalse.ret_position (str, optional) – Type of the position of next text to be returned. Please choose from
["line", "word"]. Defaults to"word".
- Returns
imgwithtextdrawn.- Return type
Image.Image
- veditor.utils.image_utils.check_font_size(text: str, ttfontname: str, img: Optional[PIL.Image.Image] = None, xy: Tuple = (0, 0), **kwargs) → Tuple[int, int][source]
Find out the text when writing letters using
draw_text_in_pil.- Parameters
text (str) – Text to be drawn to
img.ttfontname (str) – A filename or file-like object containing a TrueType font.
img (Optional[Image.Image], optional) – The image to draw in. If this argment is
None, img will be created usingimg_sizeandbgRGBarguments. Defaults toNone.xy (Tuple, optional) – Where to write the
text. This value means the coordinates of (x,y). Defaults to(0, 0).
- Returns
Calculated text size (width, height)
- Return type
Tuple[int, int]
- veditor.utils.image_utils.draw_cross(img: PIL.Image.Image, size: Union[Tuple[int, int], int], width: int = 5, fill_color: Tuple[int, int, int] = (255, 0, 0, 255), outline: Optional[Tuple[int, int, int]] = None, color_mode: str = 'RGBA', margin: int = 0, **kwargs) → PIL.Image.Image[source]
Draw Cross Mark.
- Parameters
img (Image.Image) – Pillow Image.
size (Union[Tuple[int,int],int]) – Cross mark size. (width,Height.
width (int, optional) – The width of the cross mark. Defaults to
5.fill_color (Tuple[int,int,int], optional) – The color in the line. Defaults to
(255,0,0,255).outline (Optional[Tuple[int,int,int]], optional) – The color of the edge of the line. Defaults to
None.color_mode (str, optional) – Color Mode (ex.
"RGBA","P". Defaults to"RGBA".margin (int, optional) – Specify the position. Defaults to
0.
- Returns
[description]
- Return type
Image.Image
>>> from PIL import Image
>>> from veditor.utils import draw_cross, SampleData, cv2plot, pil2arr
>>> base = Image.open(SampleData().IMAGE_PATH)
>>> img_square = draw_cross(img=base, size=200, width=10)
>>> img_rect = draw_cross(img=base, size=(100,200), width=10, outline=(0,255,0))
>>> fig, axes = plt.subplots(ncols=3, figsize=(18, 4))
>>> for ax, img in zip(axes, [base, img_square, img_rect]):
...     ax = cv2plot(pil2arr(img), ax=ax)
>>> fig.show()

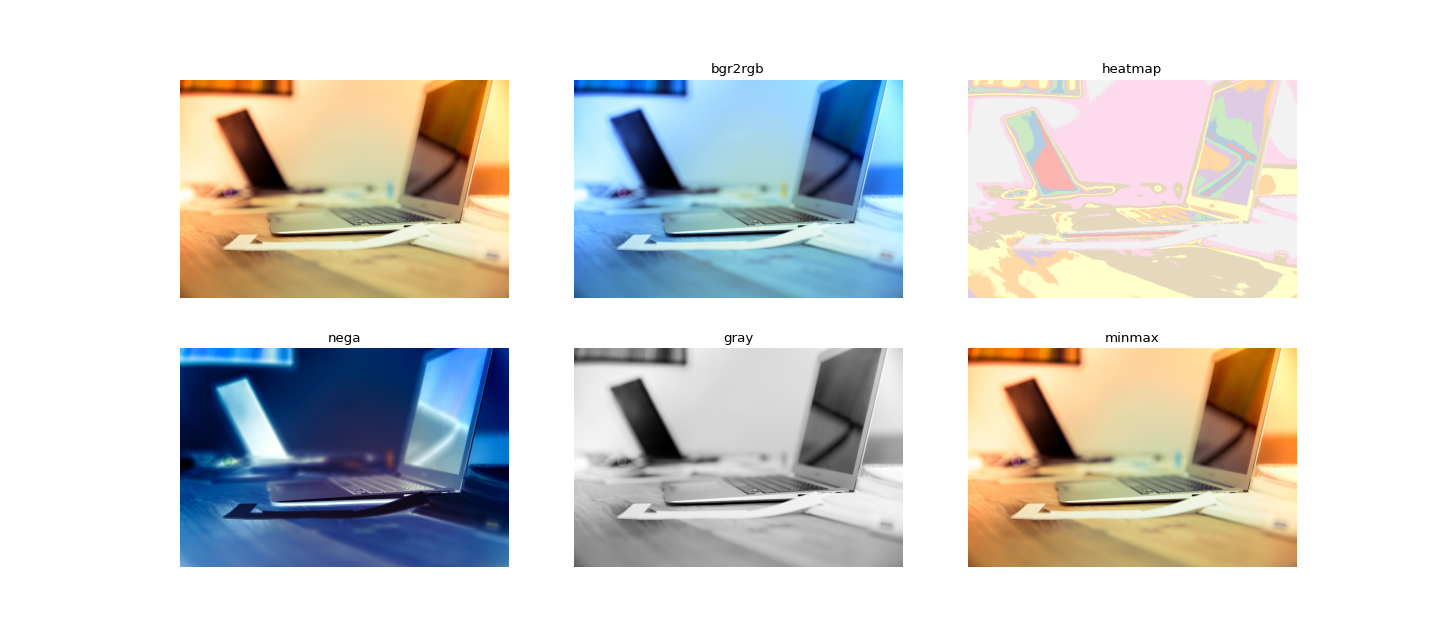
- veditor.utils.image_utils.image_conversion(frame: numpy.ndarray[Any, numpy.dtype[numpy.uint8]], method: str, cmap: Union[str, matplotlib.colors.Colormap] = 'Pastel1') → numpy.ndarray[Any, numpy.dtype[numpy.uint8]][source]
Convert image by
methodmethod- Parameters
frame (npt.NDArray[np.uint8]) – Input image (BGR).
method (str) – How to convert an image.
- Returns
Converted image.
- Return type
npt.NDArray[np.uint8]
>>> import cv2
>>> import matplotlib.pyplot as plt
>>> from veditor.utils import (
...     SUPPORTED_CONVERSION_METHODS,
...     cv2plot,
...     image_conversion,
...     SampleData,
>>> )
>>> frame = cv2.imread(SampleData().IMAGE_PATH)
>>> num_methods = len(SUPPORTED_CONVERSION_METHODS)
>>> ncols = 3; nrows = num_methods//ncols
>>> fig, axes = plt.subplots(ncols=ncols, nrows=nrows, figsize=(6 * ncols, 4 * nrows))
>>> for i,method in enumerate(SUPPORTED_CONVERSION_METHODS):
...     ax = cv2plot(image_conversion(frame, method=method), ax=axes[i%2][i//2])
...     ax.set_title(method)
>>> fig.show()
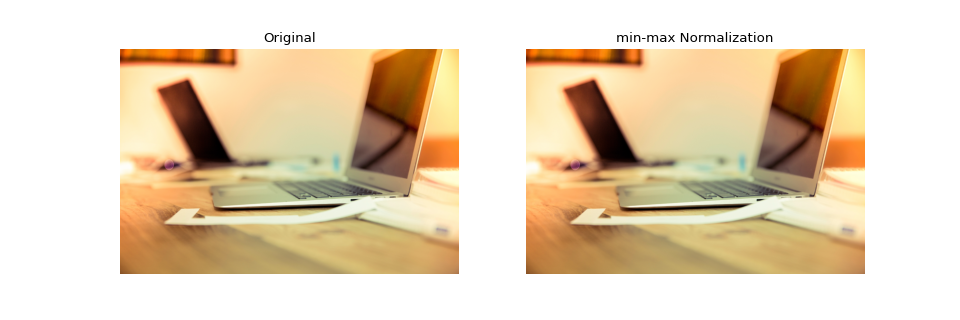
- veditor.utils.image_utils.min_max_normalization(frame: numpy.ndarray[Any, numpy.dtype[numpy.uint8]], axis: Optional[int] = None) → numpy.ndarray[Any, numpy.dtype[numpy.uint8]][source]
Perform the following min-max normalization.
\[x^{\prime} = \frac{x - \min(x)}{\max(x) - \min(x)}\]- Parameters
frame (npt.NDArray[np.uint8]) – Input image (BGR).
axis (Optional[int], optional) – Axis or axes along which to operate. Defaults to
None.
- Returns
Min-max normalized frame. (0 ~ 255)
- Return type
npt.NDArray[np.uint8]
>>> import cv2
>>> import matplotlib.pyplot as plt
>>> from veditor.utils import cv2plot, SampleData, min_max_normalization
>>> frame = cv2.imread(SampleData().IMAGE_PATH)
>>> fig, axes = plt.subplots(ncols=2, figsize=(6*2, 4))
>>> ax = cv2plot(frame, ax=axes[0])
>>> ax.set_title("Original")
>>> ax = cv2plot(min_max_normalization(frame=frame), ax=axes[1])
>>> ax.set_title("min-max Normalization")
>>> fig.show()
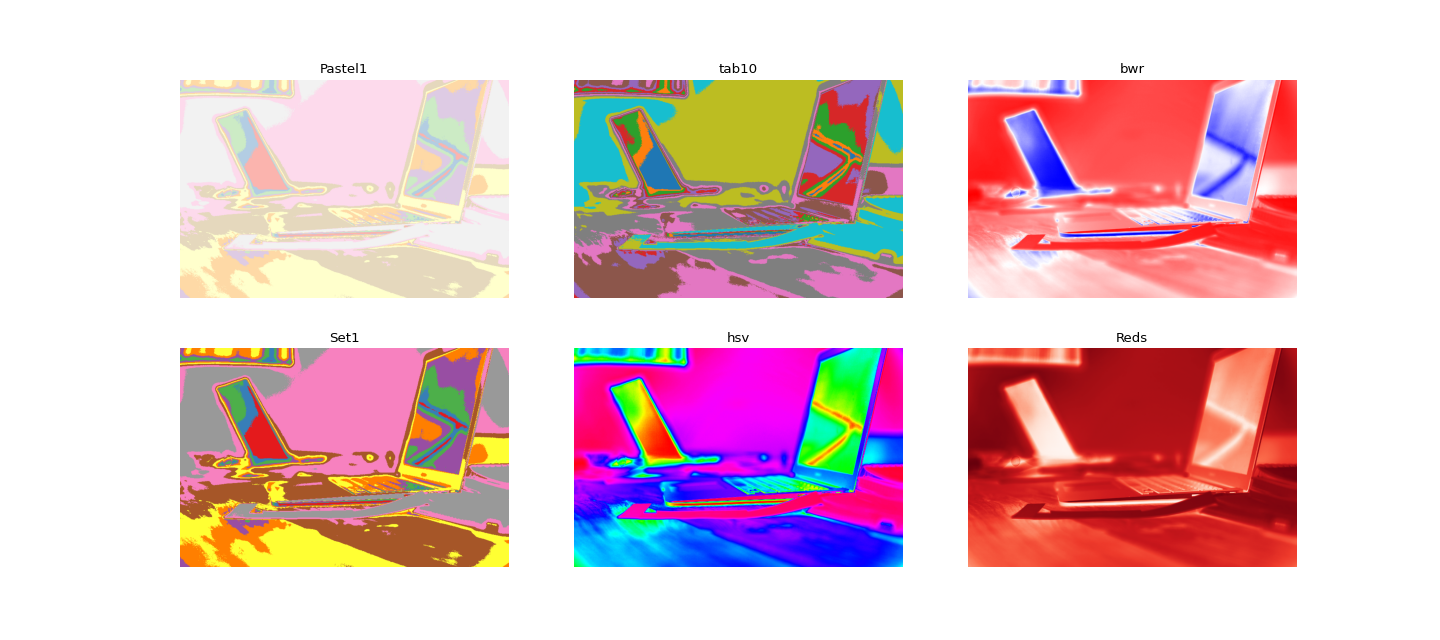
- veditor.utils.image_utils.apply_heatmap(frame: numpy.ndarray[Any, numpy.dtype[numpy.uint8]], cmap: Union[str, matplotlib.colors.Colormap] = 'Pastel1', normalize: bool = True) → numpy.ndarray[Any, numpy.dtype[numpy.uint8]][source]
Apply heatmap to an input BGR image.
- Parameters
frame (npt.NDArray[np.uint8]) – Input image (BGR).
cmap (Union[str, Colormap], optional) – An identifier for color maps. Defaults to
"Pastel1".normalize (bool, optional) – Whether to perform
min-max normalization. Defaults toTrue.
- Returns
[description]
- Return type
npt.NDArray[np.uint8]
>>> import cv2
>>> import matplotlib.pyplot as plt
>>> from veditor.utils import cv2plot, SampleData, apply_heatmap
>>> frame = cv2.imread(SampleData().IMAGE_PATH)
>>> colormaps = ["Pastel1", "Set1", "tab10", "hsv", "bwr", "Reds"]
>>> num_methods = len(colormaps)
>>> ncols = 3; nrows = num_methods//ncols
>>> fig, axes = plt.subplots(ncols=ncols, nrows=nrows, figsize=(6 * ncols, 4 * nrows))
>>> for i,cmap in enumerate(colormaps):
...     ax = cv2plot(apply_heatmap(frame, cmap=cmap), ax=axes[i%2][i//2])
...     ax.set_title(cmap)
>>> fig.show()
- veditor.utils.image_utils.nega_conversion(frame: numpy.ndarray[Any, numpy.dtype[numpy.uint8]]) → numpy.ndarray[Any, numpy.dtype[numpy.uint8]][source]
Convert images to negative and positive.
- Parameters
frame (npt.NDArray[np.uint8]) – Input image (BGR).
- Returns
A nega-posi converted image.
- Return type
npt.NDArray[np.uint8]
>>> import cv2
>>> import matplotlib.pyplot as plt
>>> from veditor.utils import cv2plot, SampleData, nega_conversion
>>> frame = cv2.imread(SampleData().IMAGE_PATH)
>>> fig, axes = plt.subplots(ncols=2, figsize=(6*2, 4))
>>> ax = cv2plot(frame, ax=axes[0])
>>> ax.set_title("Original")
>>> ax = cv2plot(nega_conversion(frame=frame), ax=axes[1])
>>> ax.set_title("Nega-posi Conversion")
>>> fig.show()

- veditor.utils.image_utils.alpha_composite(bg: PIL.Image.Image, paste: PIL.Image.Image, box: Tuple[int, int] = (0, 0)) → PIL.Image.Image[source]
Paste the
pasteimage tobgwith considering alpha channel.- Parameters
bg (Image.Image) – Background Image.
paste (Image.Image) – Image to paste.
box (Tuple[int,int], optional) – Where to paste the
pasteimage onbgimage. Defaults to(0,0).
- Returns
The alpha-composited image.
- Return type
Image.Image