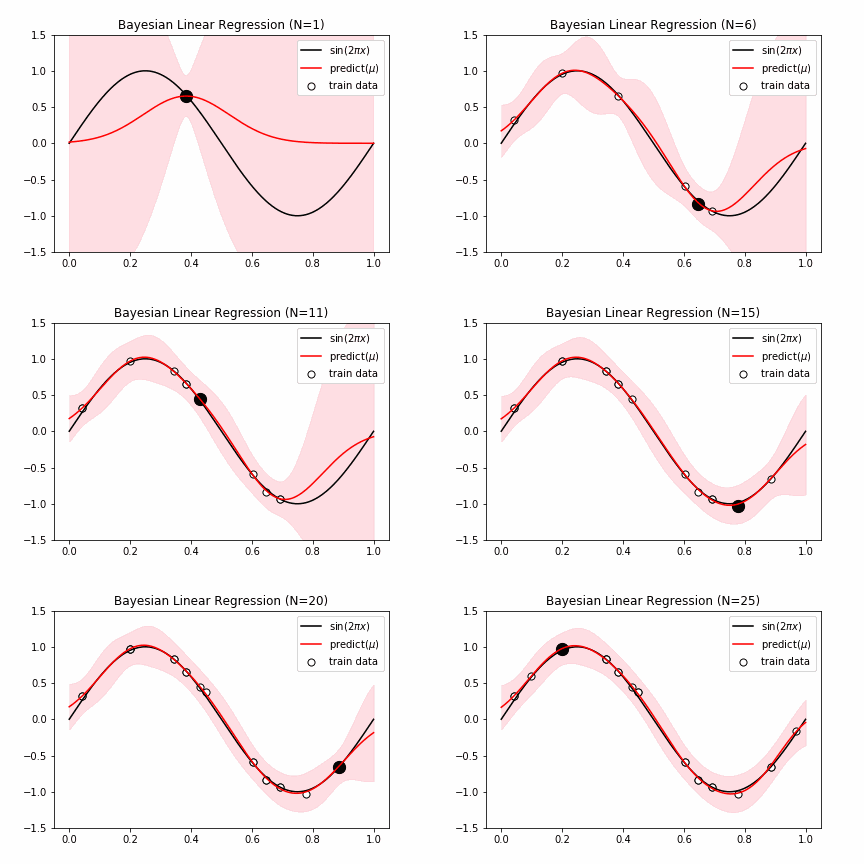
In [1]:
import numpy as np
import matplotlib.pyplot as plt
$N$ 枚の画像を plot
Vsize, Hsize = () # 画像の横の長さと縦の長さ。
n_fig = "画像の枚数"
n_col = "横に並ぶ数"
n_row = n_fig//n_col+1 if n_fig%n_col != 0 else n_fig//n_col # 行数を計算。

fig = plt.figure(figsize=(Vsize*n_col, Hsize*n_row))
for i,hoge in enumerate(HOGEs):
    ax = fig.add_subplot(row,col,i+1)
    """
    描きたいオブジェクトをプロット
    """

plt.tight_layout()
plt.show()
$N$ 色をグラデーション的に利用。
In [2]:
import matplotlib.pyplot as plt
import matplotlib.cm as cm

N = 30
for n in range(N):
    plt.plot((0,1),(0,n),color=cm.jet(n/N))
plt.show()
gifの画像の作成
上のようにやって全ての画像をまとめた一枚の画像を出力しても良いが、
n_fig = "画像の枚数"
digit = len(str(N))
for i,hoge in enumerate(HOGEs):
    ax = fig.add_subplot(row,col,i+1)
    plt.figure(figsize="サイズ")
    """
    描きたいオブジェクトをプロット
    """
    plt.savefig(f"img{i:>0{digit}}.png")
として連番の画像を作成し、それを以下のプログラムでgif画像にした方が見やすい場合もある
from PIL import Image

N = 30
digit = len(str(N))
images = []
for i in range(N):
    img = Image.open(f"{i:>0{digit}}.png")
    images.append(img)

images[0].save('out.gif', save_all=True, append_images=images[1:], loop=0, duration=300)
# loop=0: 無限ループ
# duration: 一枚あたりの表示時間[ms]

cmaps
In [3]:
cmaps = ['Accent', 'Blues', 'BrBG', 'BuGn', 'BuPu', 'CMRmap', 'Dark2', 'GnBu', 'Greens', 'Greys', 'OrRd', 'Oranges', 'PRGn', 'Paired', 'Pastel1', 'Pastel2', 'PiYG', 'PuBu', 'PuBuGn', 'PuOr', 'PuRd', 'Purples', 'RdBu', 'RdGy', 'RdPu', 'RdYlBu', 'RdYlGn', 'Reds', 'Set1', 'Set2', 'Set3', 'Spectral', 'Wistia', 'YlGn', 'YlGnBu', 'YlOrBr', 'YlOrRd', 'afmhot', 'autumn', 'binary', 'bone', 'brg', 'bwr', 'cividis', 'cool', 'coolwarm', 'copper', 'cubehelix', 'flag', 'gist_earth', 'gist_gray', 'gist_heat', 'gist_ncar', 'gist_rainbow', 'gist_stern', 'gist_yarg', 'gnuplot', 'gnuplot2', 'gray', 'hot', 'hsv', 'inferno', 'jet', 'magma', 'nipy_spectral', 'ocean', 'pink', 'plasma', 'prism', 'rainbow', 'seismic', 'spring', 'summer', 'tab10', 'tab20', 'tab20b', 'tab20c', 'terrain', 'viridis', 'winter']
In [4]:
matrix = np.arange(100).reshape(10,10)
In [5]:
Vsize, Hsize = (4,4)
n_fig = len(cmaps)
n_col = 4
n_row = n_fig//n_col+1 if n_fig%n_col != 0 else n_fig//n_col
In [6]:
fig = plt.figure(figsize=(Vsize*n_col, Hsize*n_row))

for i,cmap in enumerate(cmaps):
    ax = fig.add_subplot(n_row,n_col,i+1)
    ax.matshow(matrix, cmap=cmap)
    ax.set_title(f"↓ {cmap} ↓", fontsize=24), ax.set_xticks([]), ax.set_yticks([])
plt.tight_layout()
plt.show()
In [ ]: