pycharmers.matplotlib.plot3d module
-
pycharmers.matplotlib.plot3d.stl2mpl_data(filename, ratio=1.0, seed=None)[source]¶ Create A collection of 3D polygons from STL file.
Note
When converting STL data to 3D Polygons, the number of data points becomes extremely large, so it is better to do sampling using the
ratioparameter.- Parameters
filename (str) – The STL file to load
ratio (float/int) – Sampling percentage or the exact number of sampling data points.
seed (int) – Value to ensure sampling reproducibility
References
-
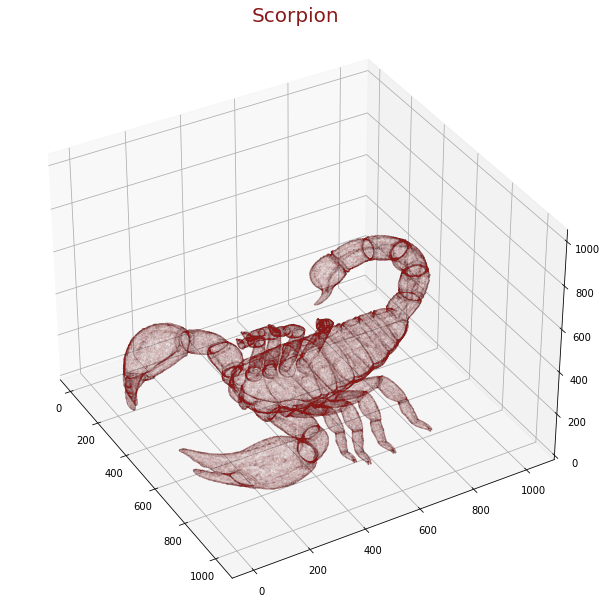
pycharmers.matplotlib.plot3d.plot_stl_file(filename, ax=None, ratio=1.0, seed=None, alpha=1, color=None)[source]¶ Plot STL data.
Note
When converting STL data to 3D Polygons, the number of data points becomes extremely large, so it is better to do sampling using the
ratioparameter.- Parameters
filename (str) – The STL file to load
ax (Axes) – The 3D
Axesinstance.ratio (float/int) – Sampling percentage or the exact number of sampling data points.
seed (int) – Value to ensure sampling reproducibility
alpha (float) – The alpha blending value, between 0 (transparent) and 1 (opaque).
color (str) – The edge color of the marker.
Examples
>>> from pycharmers.matplotlib import plot_stl_file, FigAxes_create, set_ax_info
>>> fig, ax = FigAxes_create(figsize=(8,8), projection="3d", nplots=1)[0]
>>> plot_stl_file("Scorpion.stl", ax=ax, ratio=.5, alpha=0.01, color="red")
>>> set_ax_info(ax, title="Scorpion")
>>> fig.savefig("Scorpion.png")
References
If you want to see the result of the
Examples, see my tweetResults